


Perfiles de imagen
Descripción Herramienta de Perfiles
This tool allows visualising as a graphic the spectral profile of one point of the image (Z Profile) or the profile of a series of pixel belonging to a path drawn by the user.
To open the Profiles visualization tool, you have to use the remote sensing toolbar by selecting “Raster layer” from the left button and “Image profile” from the right button. You have to check that in the scrolling text window, the layer over which you want to visualize the profiles is selected.

The following window allows to define profiles over the layer.
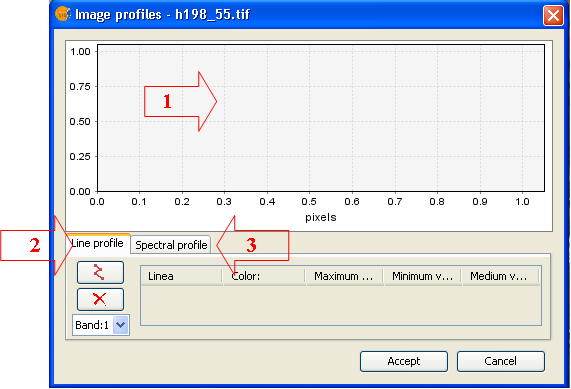
- Area over which you the graphic corresponding to the created profiles is drawn.
- Line profile. Panel to edit and visualize path profiles.
- Spectral profile. Panel to edit and visualize points spectral profiles.
Line profile
The panel to manage the line profiles disposes, in addition to the table, of the following controls

Add a new profile to the table. Once activated the control you draw the desired path over the view.

Delete the selected profile in the table by deleting the linked geometry and the graphic.

Select the band for which the profile will be created.
Spectral profile
The panel to manage point profiles has the following additional controls.

Add a new profile to the table. By control activation you choose the point on the image.
Delete the profile selected in the table by deleting the linked geometry and the graphic.


